We often recommend our fertility clients to record their basal body temperature (BBT) as it is a good way to understand your body more in depth and helps to confirm ovulation. As the name suggest, BBT is measured at the basal temperature level and is to be done once you wake up in the morning before you talk or move around. If you are not sure how to do it, you can click here to go to a previous blog that we have written about it.
In this blog, we will talk about how to read your BBT.
Recording your BBT
It is best to record your temperature in an app. It will then show you a graph and you will be able to read it easier. We recommend using a free app called ‘Fertility Friend’ as it is one of the easiest to use apps on the market.
Biphasic BBT chart
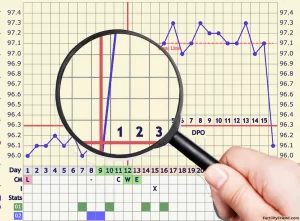
When we look at a BBT chart, it is more important to look at the overall pattern instead of day to day changes. The temperature fluctuates throughout the whole cycle due to the changes in hormonal levels and lifestyle. The temperature is supposed to be lower in the follicular phase (before ovulation) and it should rise 0.3-0.5 degrees in the luteal phrase (after ovulation). This is called a biphasic chart. An ideal chart would be clearly biphasic and has an even length between the follicular phase and the luteal phrase. It would be best if your temperatures are all above 36.0 as well.
 In clinic, we have seen charts that jump up and down a lot throughout the whole cycle, from a long follicular and short luteal phase, to a short follicular phase, low temperatures etc. It is not necessary to get the perfect BBT chart to fall pregnant however it is definitely easier if your chart is looking good. If your chart is less than ideal, it’s definitely worth a visit to see an acupuncturist to optimise your chart.
BBT drops during period time
When your period comes, all of your hormone levels drop back down to the basal level which is why the temperature is generally lower in the follicular phase. Ideally the temperature starts to drop 1-2 days before your period comes or on the day itself. Sometimes you will see a slow decline of temperature on the first few days of cycle. This suggests an incomplete bleed or spotting. It can also be the case that your progesterone is not dropping properly, however this is not always the case.
Dip in BBT before ovulation
Sometimes the BBT shows a huge temperature drop right before ovulation and this is called “ovulation dip”. This is the effect of certain hormones in your body that last only 12 hours. That’s why your BBT doesn’t always show this, it is not necessary to happen.
Ovulation Time
Your BBT chart does not predict ovulation, it rather helps to confirm ovulation. As mentioned before, the temperature rises 0.3-0.5 degrees after ovulation. If you see a higher temperature for 3 or more days, you can be sure that you have ovulated.
Implantation dip
 After ovulation, implantation can take another 7-10 days. Sometimes you can see a drop of temperature at this time and this is called an “implantation dip”. These dips only rarely show up in a BBT chart but when they do, it is a good sign of possible pregnancy.
Fertility Friend has done a statistical study on 1.5M+ charts. They found that only 1.6% of charts show a pattern of implantation dip. When this pattern shows they are 79.8% more likely to be a pregnancy chart. You can find details of the study here. Please keep in mind though, having an implantation dip does not guarantee that you are pregnant. Also if you do not have an implantation dip, it doesn’t mean you are not pregnant. Pregnancy can occur regardless of your temperature pattern.
Help with your BBT
Are you recording your BBT and need help to make sense of it? Or are you trying to improve your chart to fall pregnant?

